![[*]](crossref.png) .
.
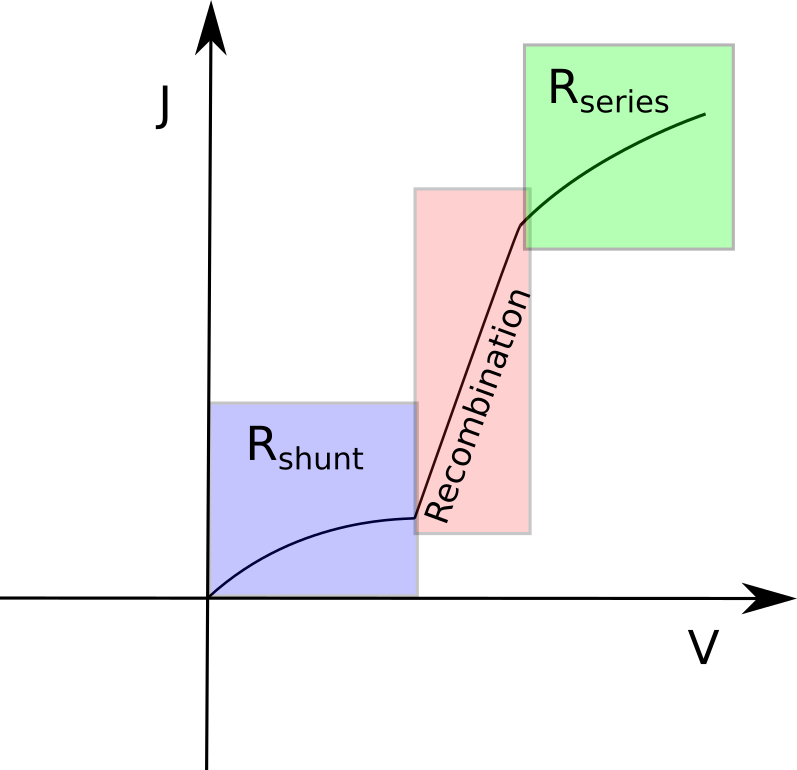
Now set the shunt resistance to
1MΩ, and run a simulation. Plot the jv curve. It is customary to plot jv curves on a x-linear y-log scale. To do this in the plot window, hit the 'l' key to do this. The shape should resemble, the JV curve in figure . Certain solar cell parameters affect different parts of the dark JV curve differently, the lower region is affected very strongly by shunt resistance, the middle part is affected strongly by recombination, and the upper part is strongly affected by the series resistance.